With oneConnect2 for Android and iOS you can view and track real time sales data for a set of configurable locations. Additionally, oneConnect2 also provides a configurable key performance indicator screen that allows users to track the most meaningful data. Multi-site screens are provided to view sales data across all configured sites. Alerts are also available on oneConnect2, and are set up through the POS. This will generate an alert report where users can determine and select the alert level for each type of event, one of which is to push notifications. Another new feature lets the user quickly get in touch with a location by showing all relevant contact information as well as manager’s info.
2. Getting Started
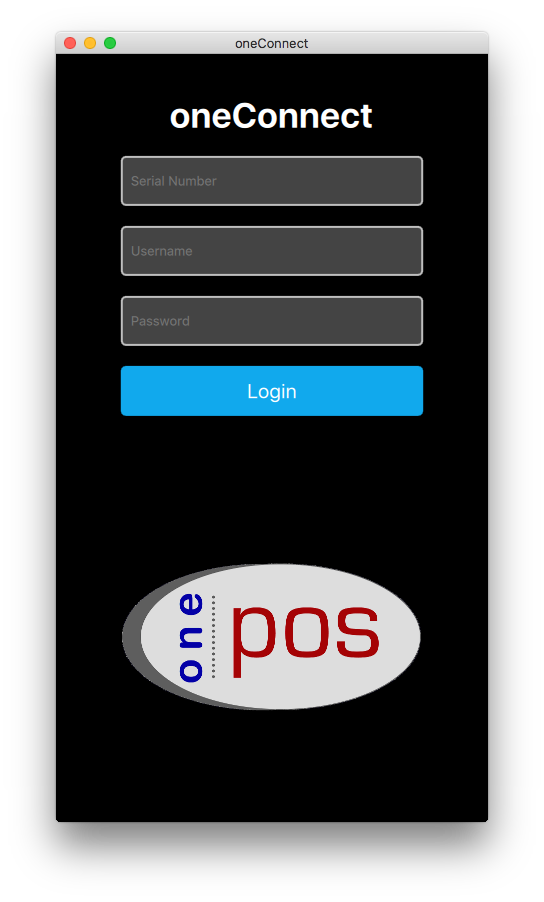
To start using oneConnect2, simply open the app on your device and login in with a location’s oneMetrix credentials (serial number, username and password). Group logins (serial numbers beginning with 80XXX) are not allowed at this time.
3. Viewing Reports
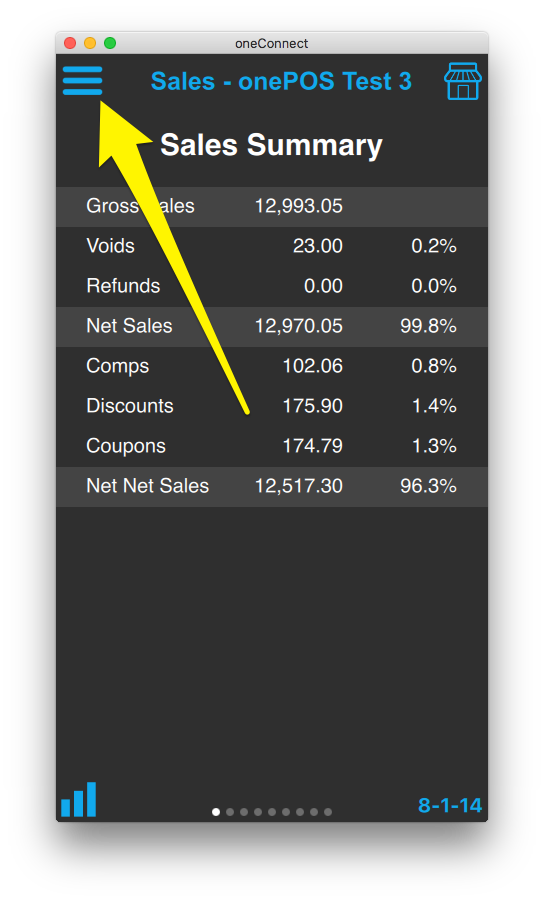
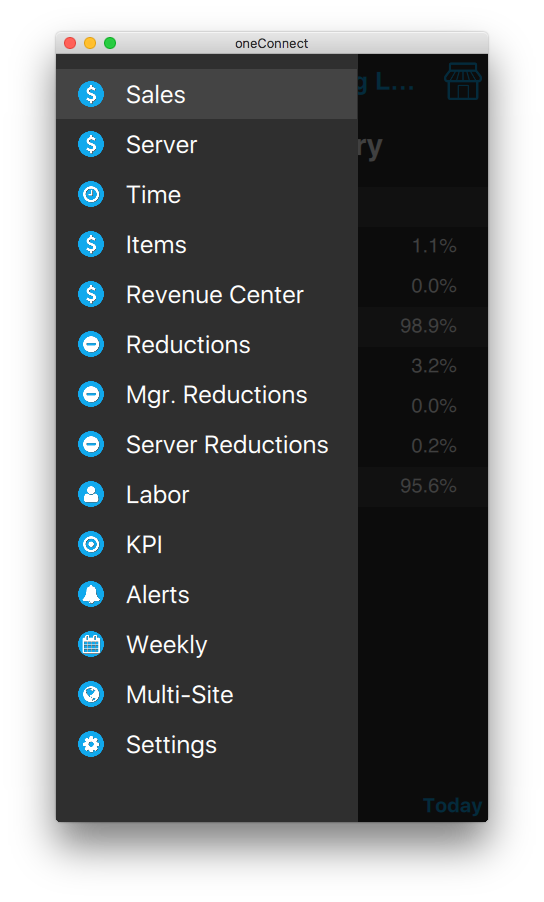
To read a report, simply click the hamburger icon in the upper left corner, or swipe from the left edge towards right to open the slide-out menu and choose a report from the list to view.
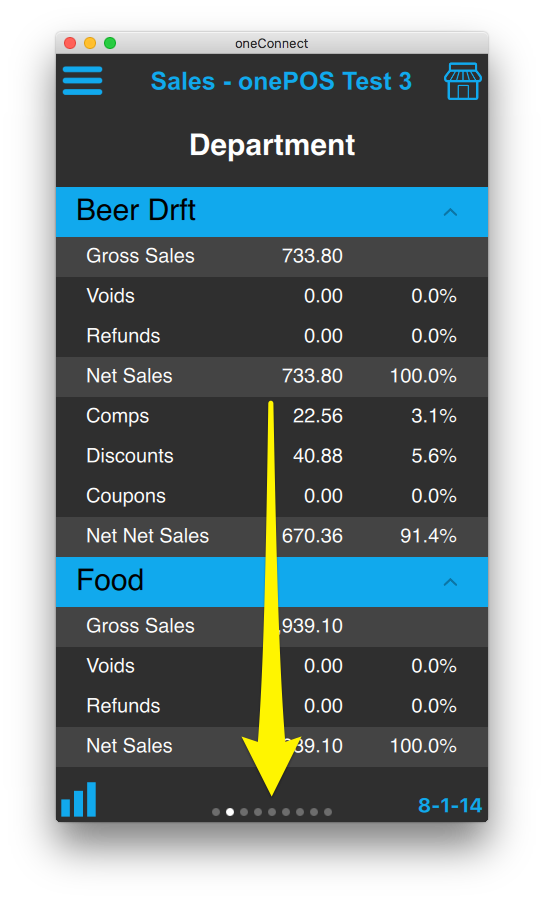
The dots at the bottom of the screen indicate how many reports are available in the currently selected category. Swipe left or right anywhere on the screen to move between reports.
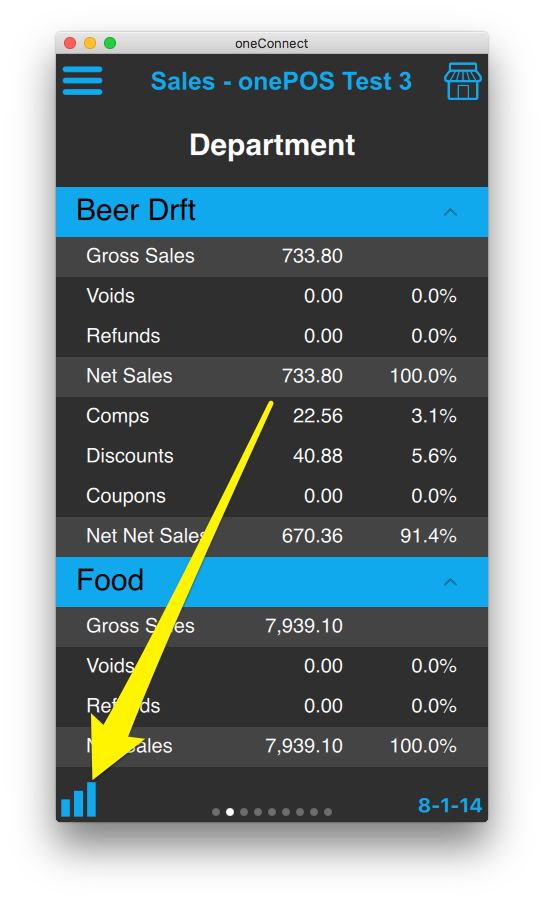
While viewing any report, the chart representing the report can be toggled on or off. Only the top ten largest items in the report are displayed.
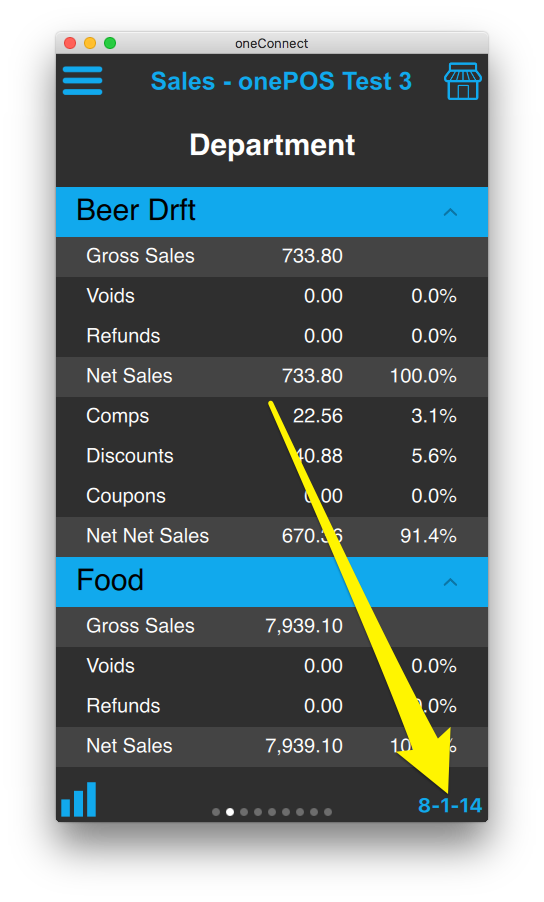
Additionally, to view report data for a different date, click the date text in the bottom right corner.
4. Adding Additional Locations
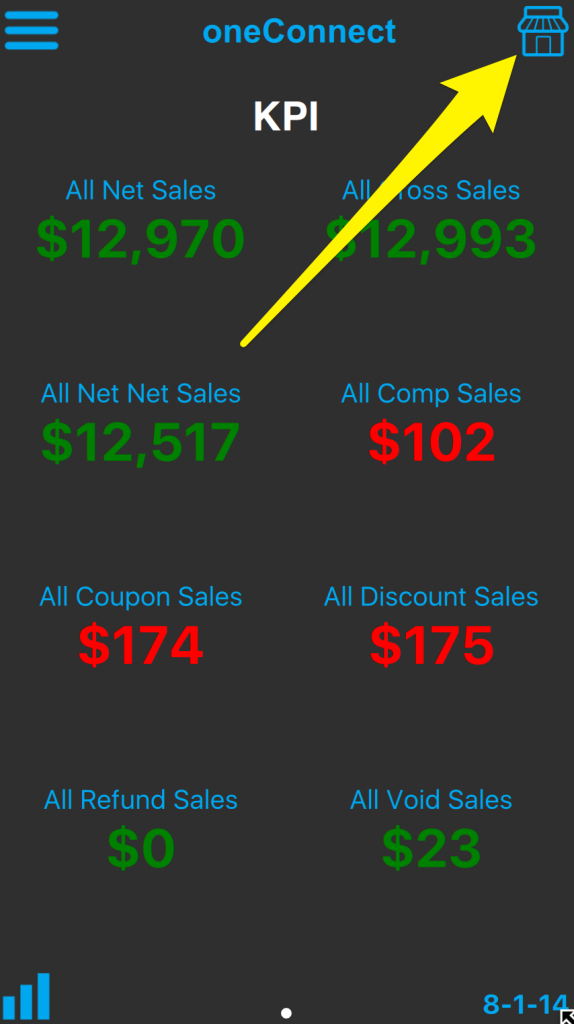
To add another location to oneConnect2, tap the store icon in the upper right corner to open the site management window.
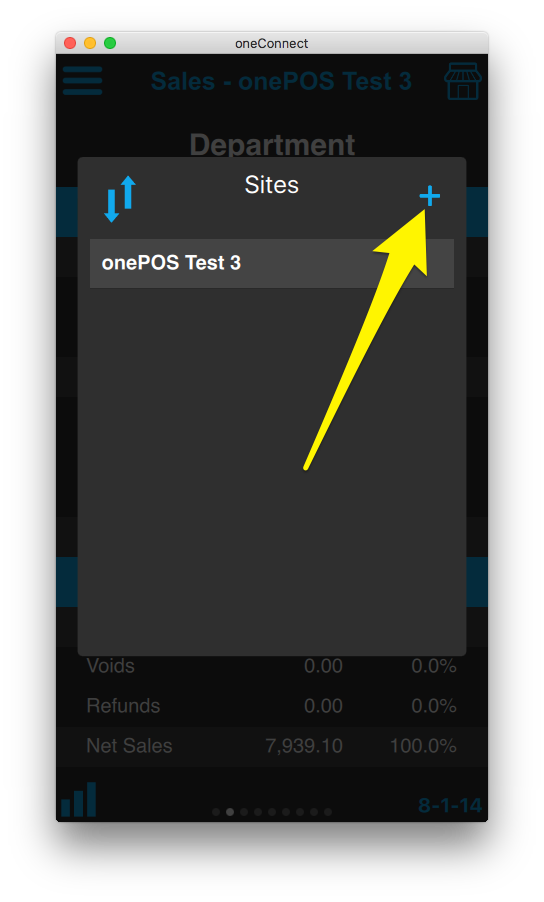
Tap the plus sign to open the ‘Add Site’ screen and enter oneMetrix credentials for an additional location.
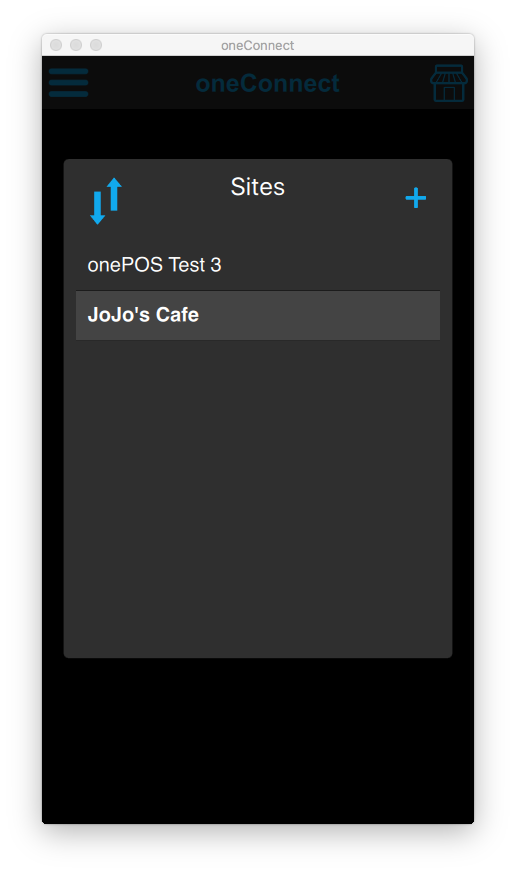
In the screenshot below, JoJo’s Cafe was recently added, and is currently the selected location as indicated by its highlight. This means reports will now show data for JoJo’s Cafe. To change this, simply tap the store icon again and select a different location.
5. Removing Locations
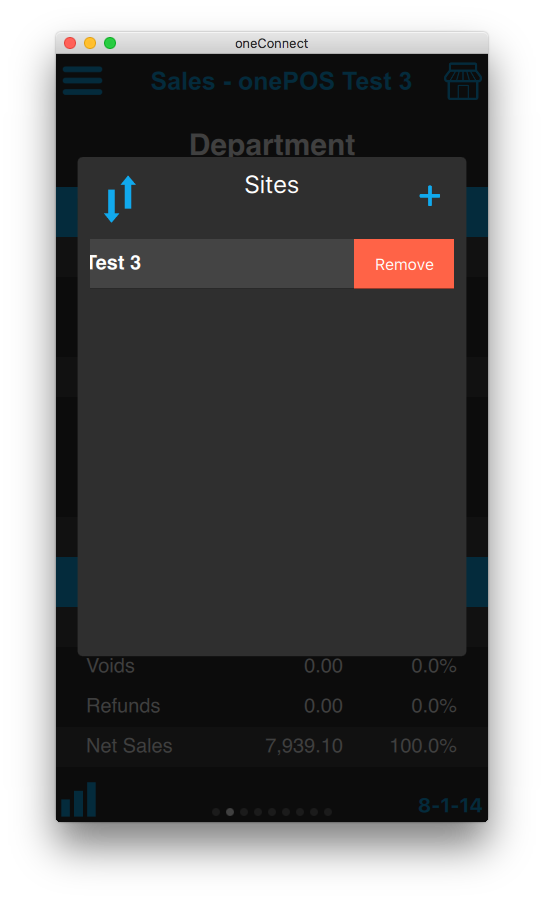
To remove a location from oneConnect2, tap the store icon in the upper right corner to open the store management window.
Swipe left on the location and tap the remove button.
6. Re-order List of Locations
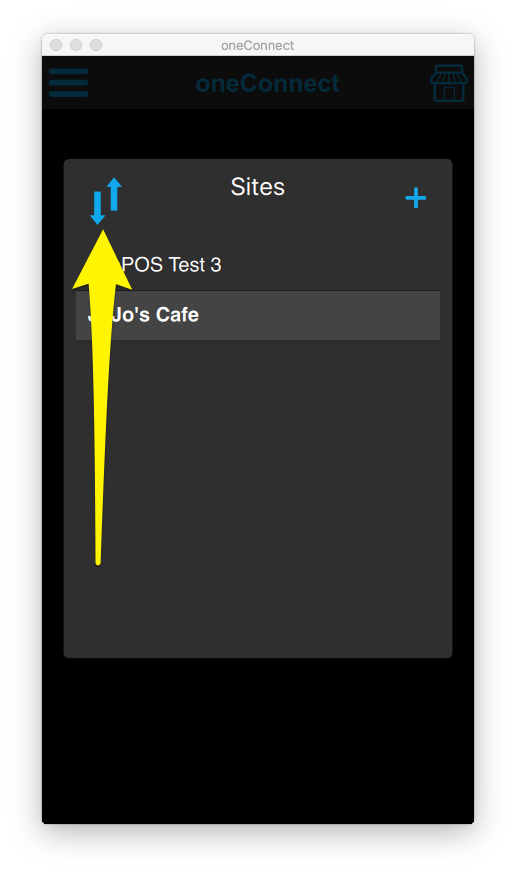
To re-order the list of locations added to oneConnect2, tap the store icon in the upper right corner.
Start by tapping the button indicated below to unlock the list for re-ordering. Then tap and drag each site up and down as desired. Finish the process by re-locking the list by tapping the up/down arrow button again.
7. View Location Contact Info
First, open the Site list by tapping the store icon in the upper right corner.
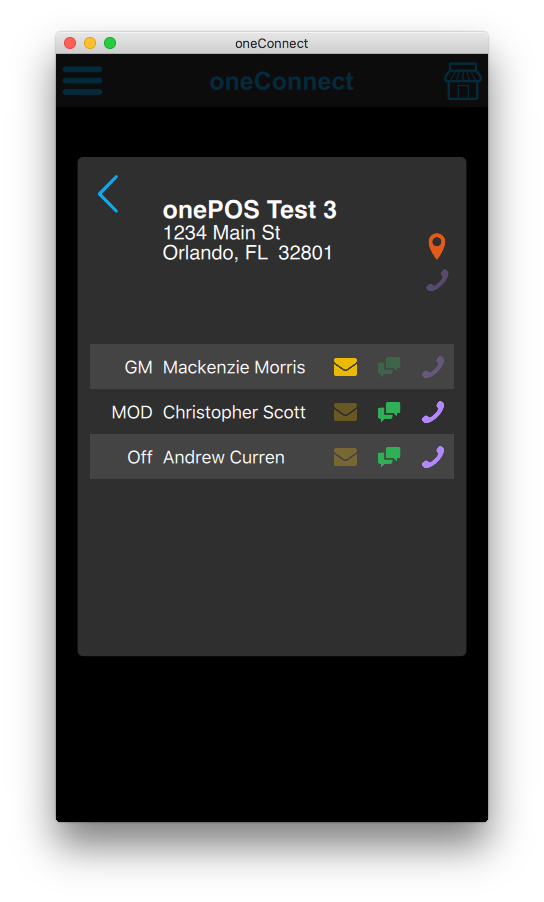
Long-press on any location in the list to view its contact information.
The Contact Info screen also contains a list of managers. GM = General Manager MOD = Manager(s) on Duty Off = Manager(s) not clocked in
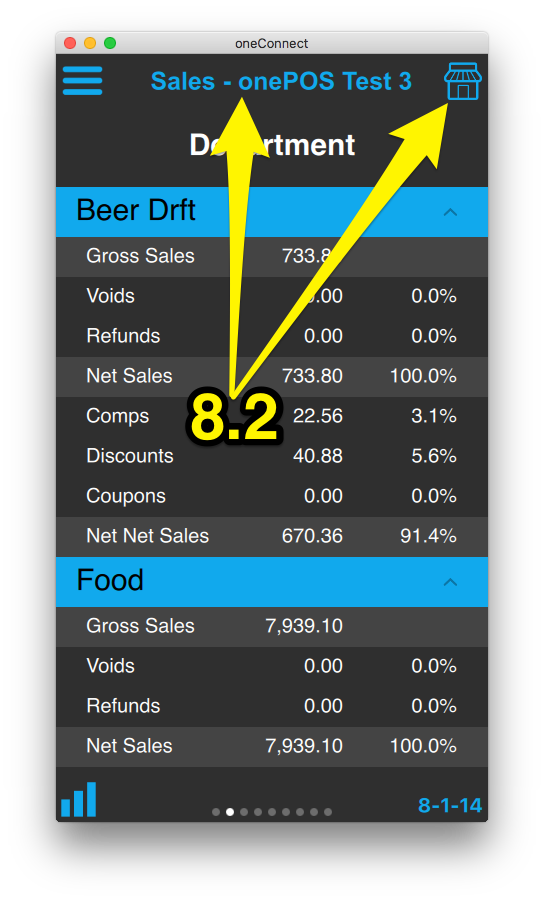
8. View The Same Report For Different Locations
In oneConnect2 it is possible to be viewing a report for one location and immediately jump to view the same report for a second location. 8.1 – Open any report. 8.2 – Tap the name of the current location or the store icon in the upper right corner to open the list of sites added. 8.3 – Tap on a another location, and the app will take you to the same report for the newly selected location.
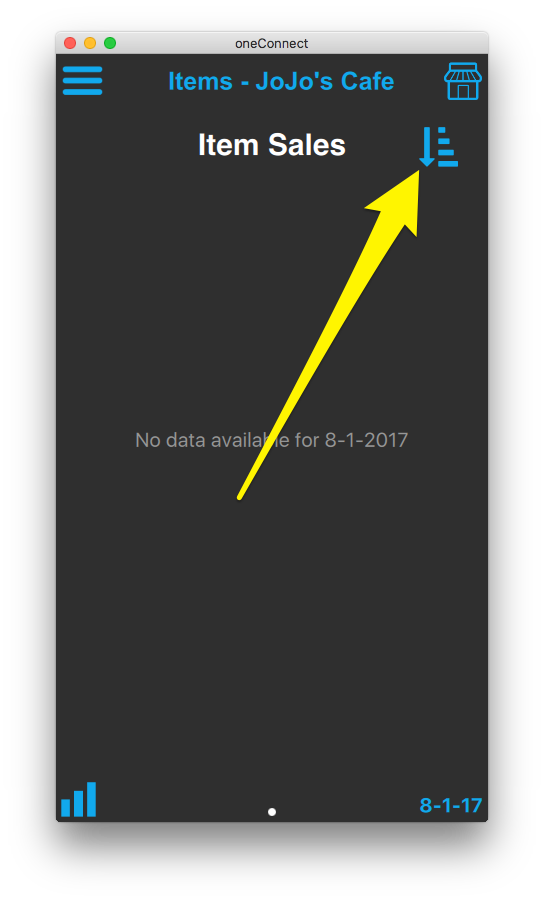
9. Change Sort Order for Item Sales
Open the Items report. Tap the button indicated below.
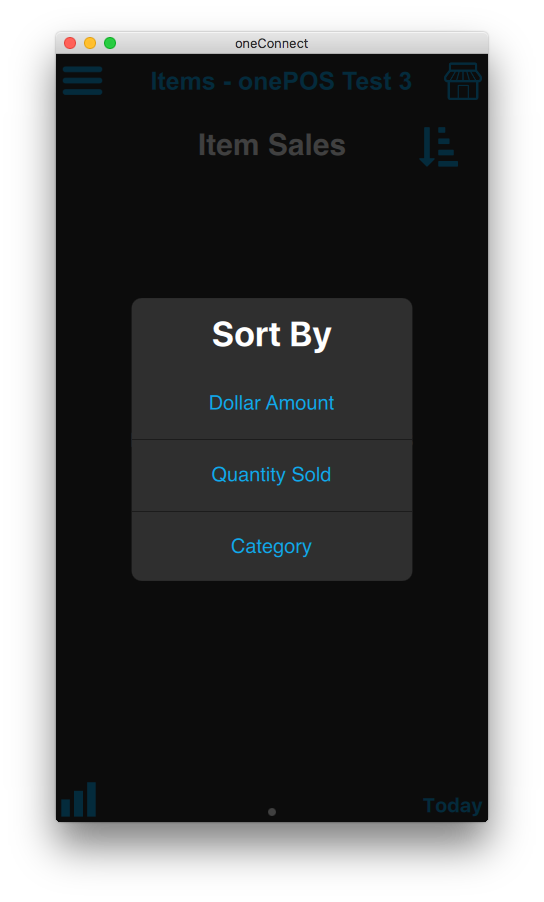
Select the desired sort order.
10. Configure KPI Report
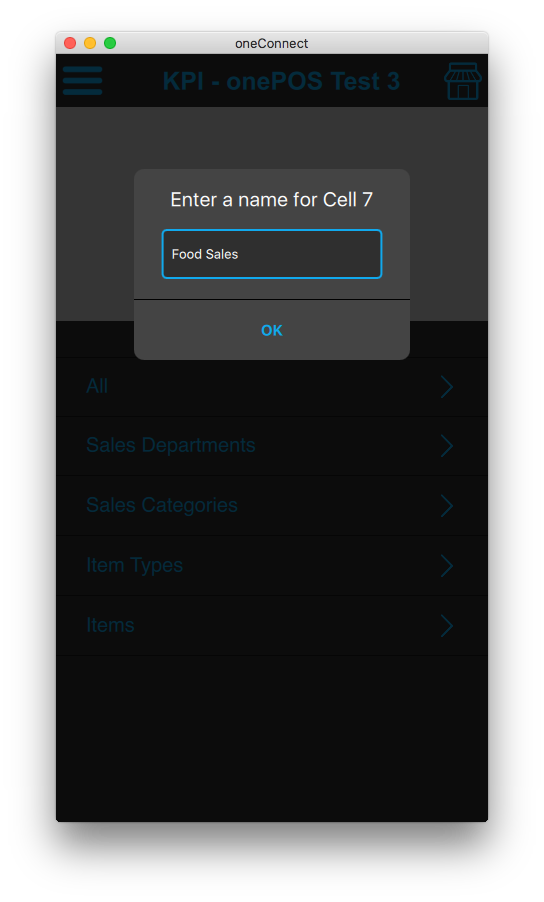
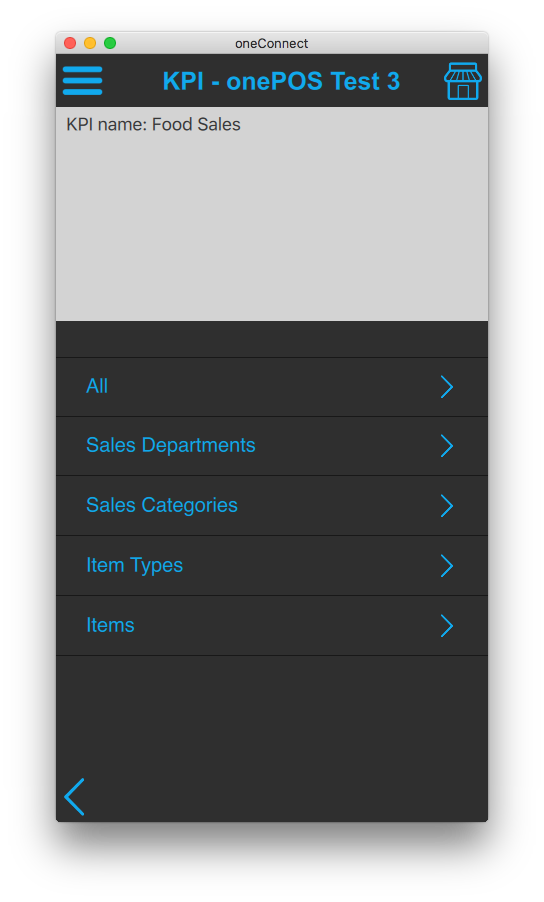
The KPI (Key Performance Indicator) report is a highly configurable sales report. It contains eight cells. To start the customization process, long-press on any cell.
10.1 Give the cell a descriptive name.
10.2 Select the first category
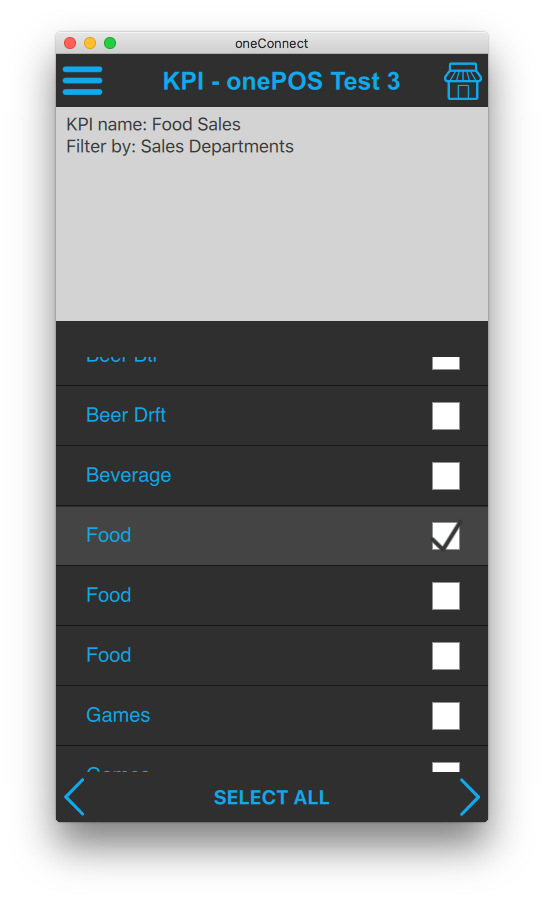
10.3 In this scenario, Sales Departments was chosen on the previous screen. On this screen we will choose one or more sales departments and tap the right arrow when done.
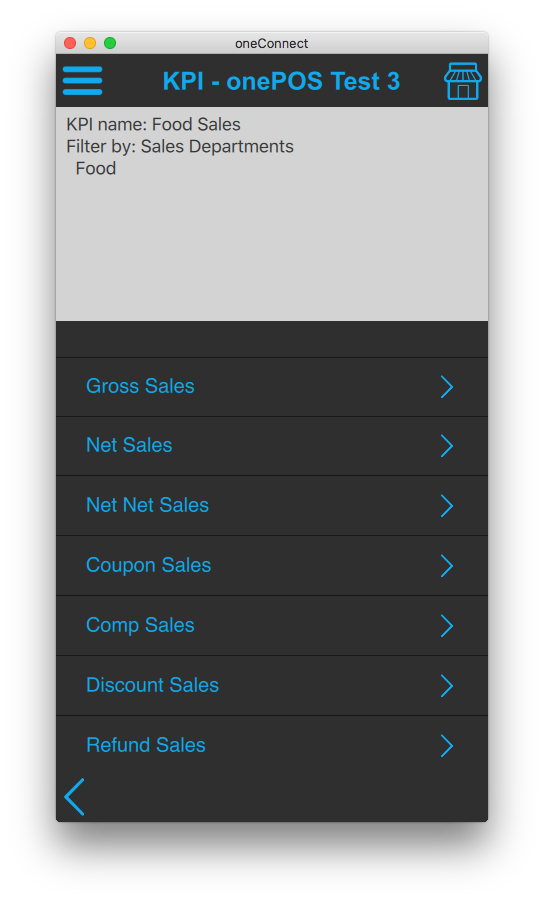
10.4 Choose the type of sales metric desired.
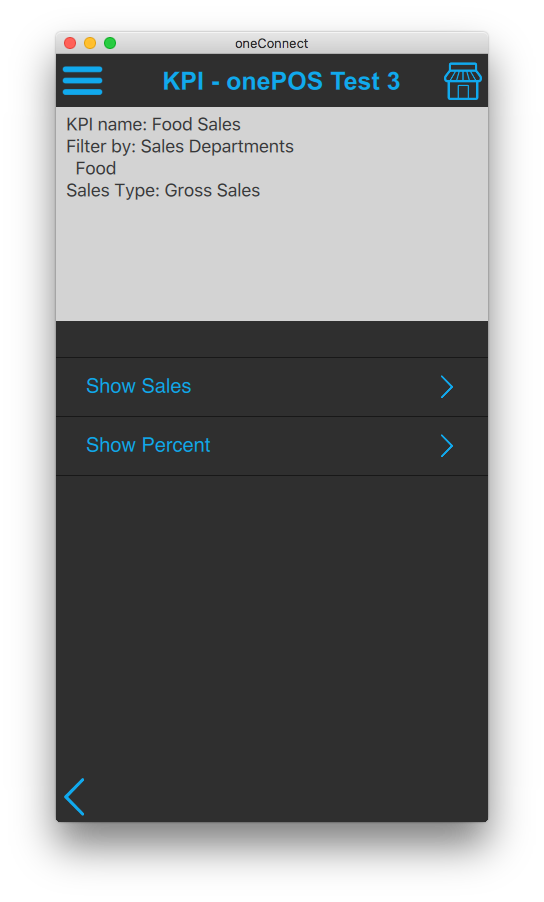
10.5 Choose whether you want to see the sales figure expressed a dollar amount or as a percentage of total gross sales.
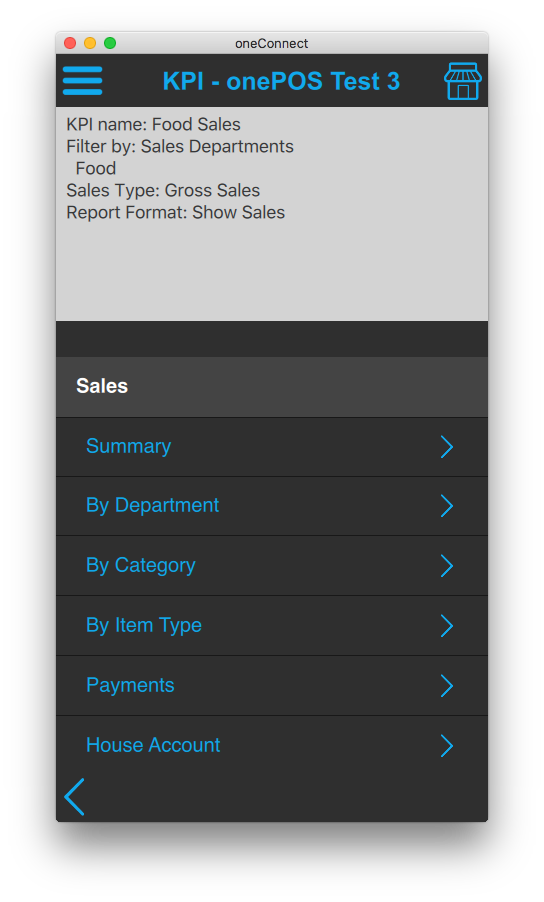
10.6 This screen contains a list of all reports available in oneConnect2. Your choice here will determine which report to jump to when performing a single tap on the cell.
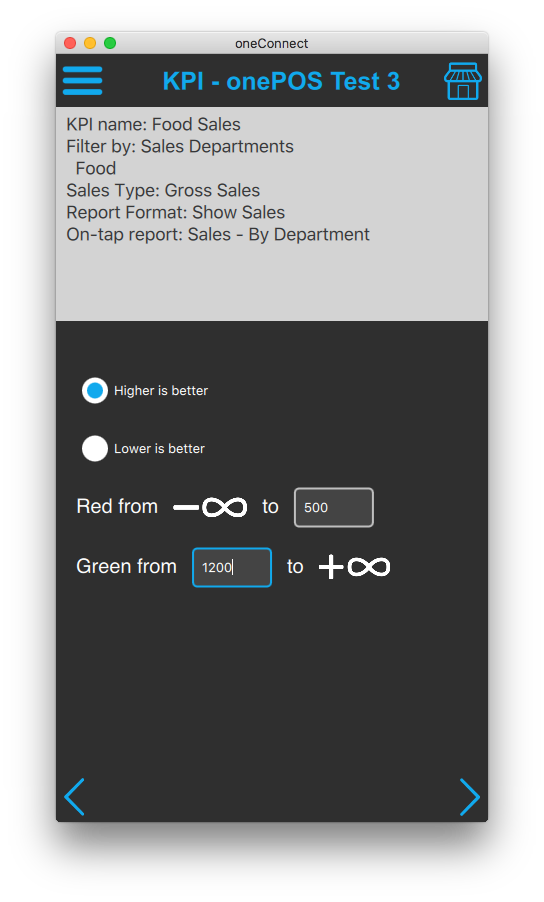
10.7 Configure the color coding of the cell. In the screenshot shown below, the cell will be red when sales range from negative infinity to $500. The cell will be green from $1200 or above. The cell will be yellow if the sales figure falls in the range between $501 – $1199.
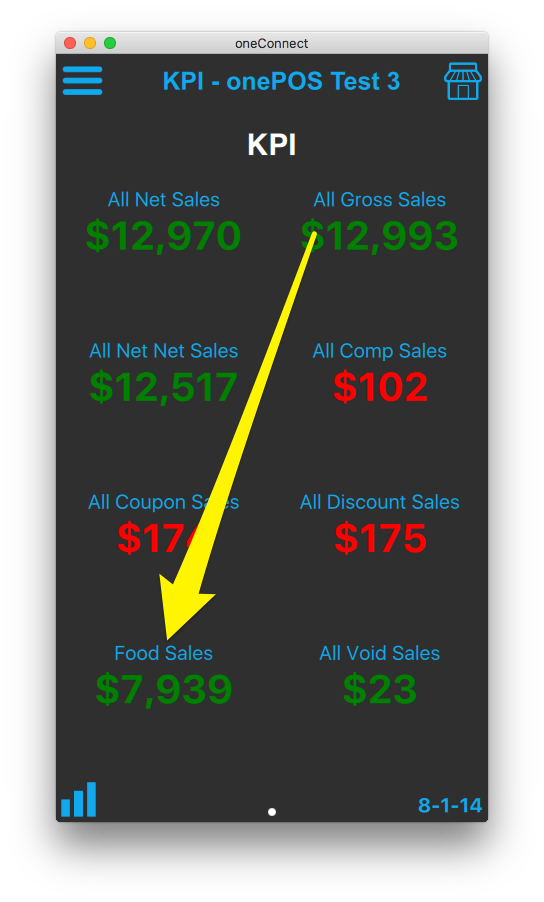
10.8 The cell configured in the previous steps now show sales figures according to your completed configuration process.
11. Push Notification Configuration
Open the Alerts report to view alerts and configure how you want them displayed. Alerts can be turned turned on/off in the POS or in oneMetrix.
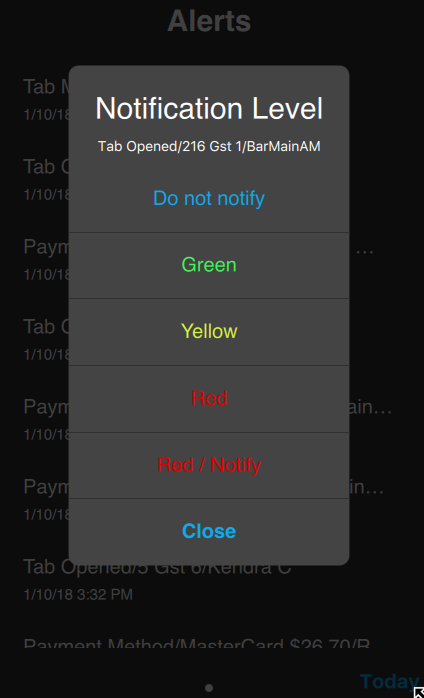
By long-pressing on any alert you can choose to highlight the alert or turn on push notifications.